Observe.
The DevOps infrastructure observability platform that enables scalability and action.
meshIQ Observability
Real-time observability platform for your integration infrastructure.
Improve your middleware observability across your enterprise integration landscape using a single pane of glass. Ingest metrics, events, logs and traces from all major messaging, event processing and streaming platforms deployed in hybrid Cloud and monitor them using a single solution. A modern enterprise uses a wide range of integration platforms such as Kafka, Azure ESB, ActiveMQ, Solace, RabbitMQ, Tibco EMS, and IBM MQ, etc., all of which expose a different set of metrics. This makes monitoring and alerting based on a wide range of metrics a huge challenge.
Full middleware observability.
- Monitor everything in real-time
- All integration platforms are supported
- Flexibility of setting of custom thresholds
Real-time alerting capabilities for maximized uptime.
- Alerts when thresholds are exceeded
- Remediate issues across all integration platforms with consistency and reliability
Ingest metrics, events, logs, and traces.
- All major integration platforms are supported
- Consistent processes from a reliable platform
Complex Infrastructures Simplified
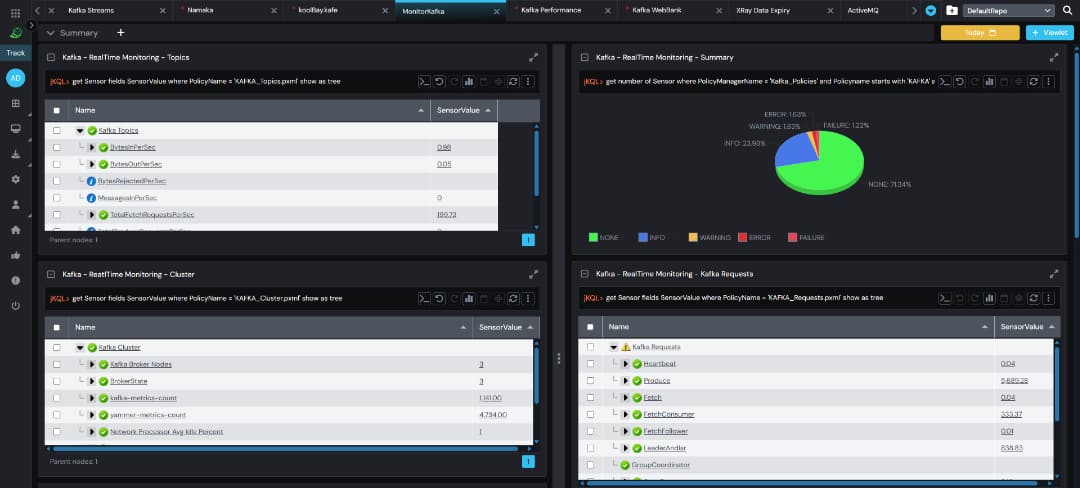
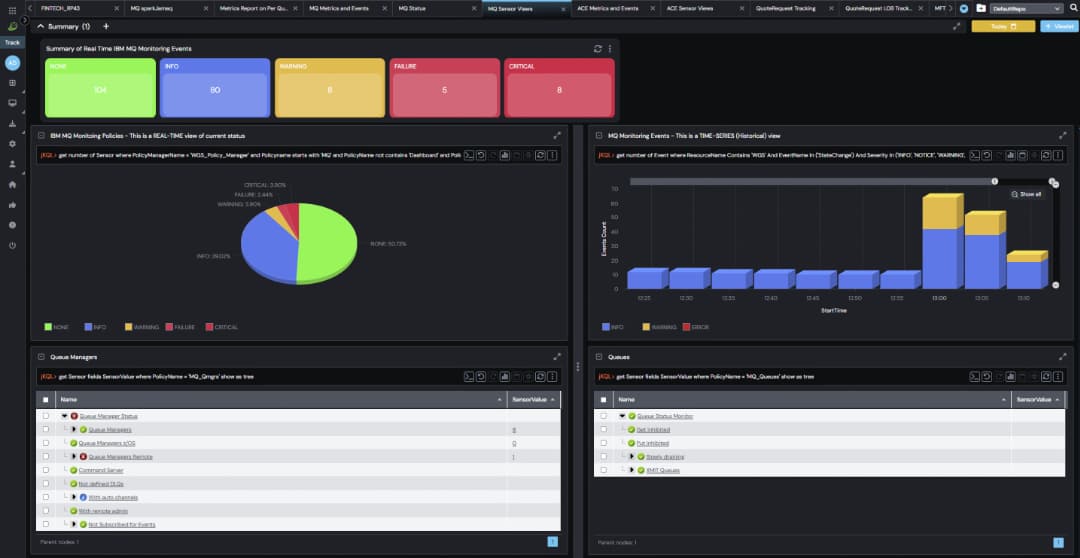
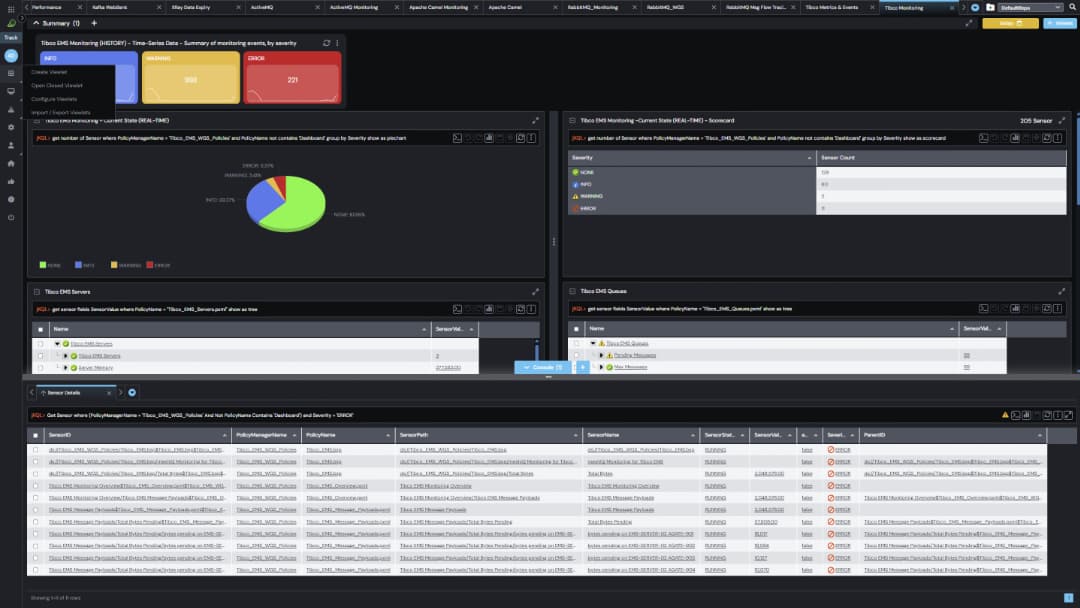
Monitor your messaging and middleware ecosystem.
See deep inside your message queues & topics to monitor the performance of your middleware systems, including message flows, message rates and availability. Proactively catch problems & bottlenecks before they impact your applications.
Proactive Alerts
Empower your team to avoid outages.
Use our wizard to create monitoring policies that deliver optimum performance. Define alerts that trigger automated actions to proactively catch and address issues before they happen.
Library of Integrations
Connect to any middleware.
No data is beyond reach thanks to our fully supported open-source library of integrations. Expand your reach to collect metrics, logs, messages and more from any middleware platform or data source.