meshIQ subscription support for open-source software.
Manage your messaging from a single screen.
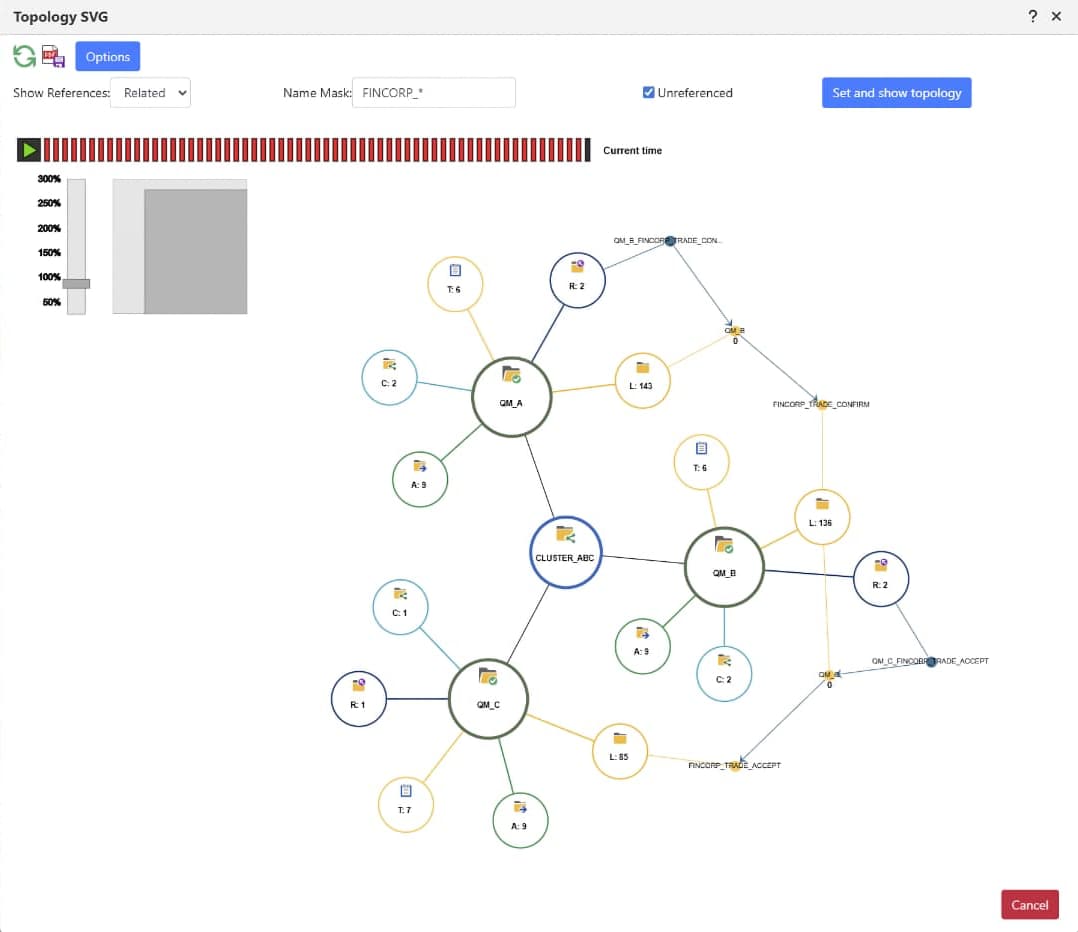
Manage multiple MQ queue managers from a single console, cross-platform, cross-instance.
Complete messaging on cloud, hybrid, or on-premise:
- Improve DevOps processes to reduce deployment and performance issues with the Messaging layer.
- Complete visibility into the Messaging infrastructure, no matter where it is deployed.
- Observe and manage irrespective of the vendor and version of the platform.
Operational monitoring and observability.
Ensure smooth, uninterrupted delivery of mission-critical digital services via tracking of metrics while simultaneously offering deep-dive insight into the underlying infrastructure itself.
meshIQ delivers real-time monitoring, with proactive alerting, and both user-defined and out-of-the-box prescriptive actions, ensuring high performance and availability of message brokers deployed across the enterprise.
meshIQ has embedded its own expertise and experience in “out-of-the-box” pre-built actionable dashboards and policies to provide business views and alerting to handle the most common situations, enabling you to get up and running straight away before using the simple wizard to configure it for your own unique scenarios.
Example scenarios include:
- Queues with/without consumers
- Connections, Exchanges, Consumers
- Publish In / Out rates
- Pending messages, Messages delivered, Messages ready for delivery
- Channel status, Channels per connection, Channel send /receive rate
- Memory usage, Disk usage
- Queue idle time, Queue memory
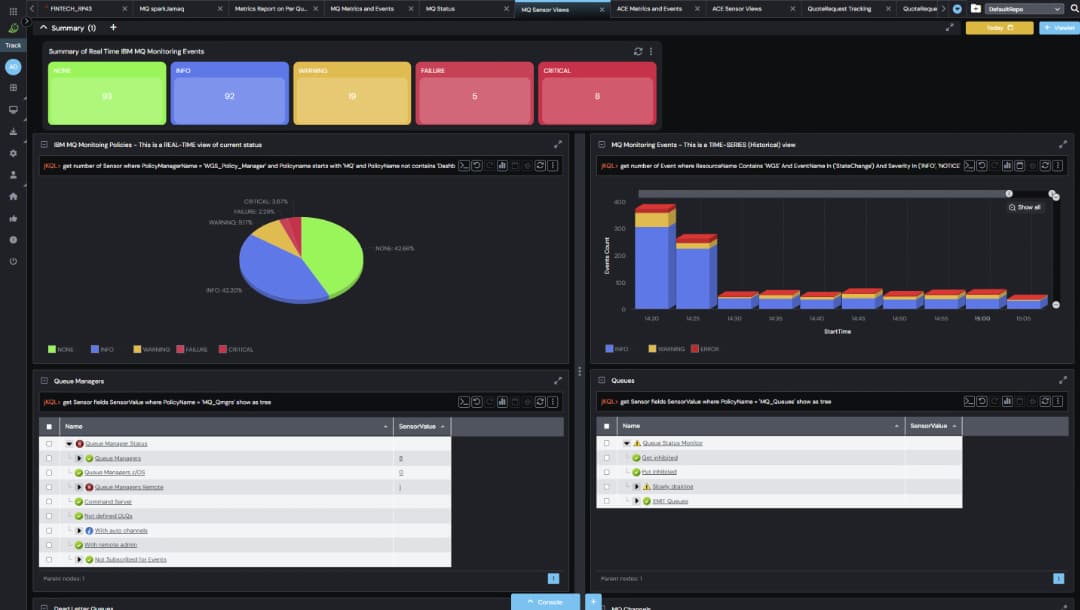
Monitor.
On-Premises, Hybrid, and Multi-Cloud.
Monitor your IBM MQ-powered deployments through your entire business, boost productivity and overall efficiency of your administrators, engineering, and operations teams to ensure smooth, uninterrupted delivery of mission-critical digital services.
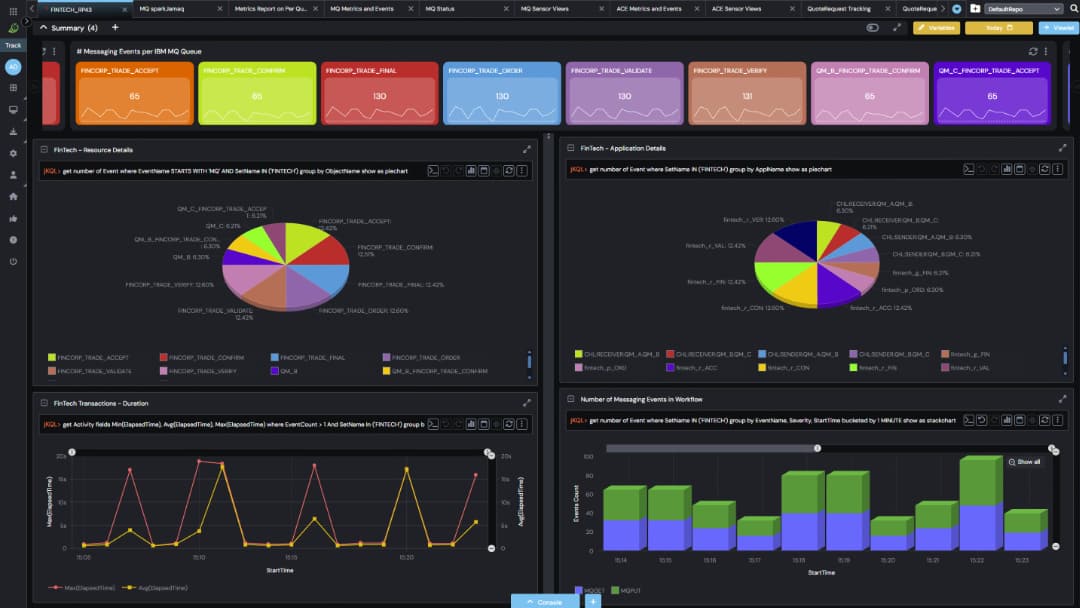
MQ transaction tracking and tracing.
Discover the pathway a user’s experience follows, and compare it to the historical record.
Visualize the pathway a user’s experience follows through your entire application stack.
Use the knowledge you have already built into MQ to provide an additional dimension of understanding.
- Trace the pathway of each transaction (or event)
- Track each transaction, comparing it to the historical record
- Overlay performance data from each system or component
- Report on any anomalies
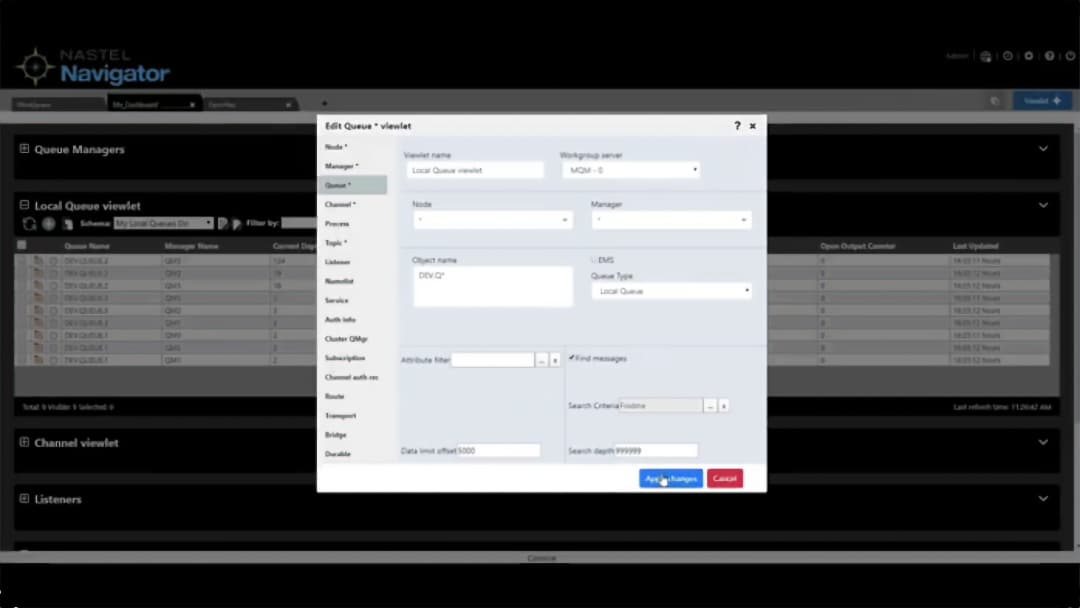
Secure self-service configuration management.
Provide developers and QA teams with the ability to manage their own middleware environments.
Many organizations need their developers and QA teams to be able to manage their own messaging queues and messages.
This enables faster time-to-market (TTM) for updates and new applications, while ensuring adherence to governance and compliance policies.
To deliver this, meshIQ provides the ability for the middleware administration team to set up privacy and security to allow each developer or team access to just their own queues.
Support for all form factors of IBM MQ.
The meshIQ platform supports all form factors of IBM MQ, including on-premises software, cloud-hosted, containerized, and the IBM MQ Appliance.
- The meshIQ software can work with a local agent or agentless. In the case of the appliance, the agentless mode is used to provide access to all the MQ metrics and management.
- Traditionally, MQ experts know all about queues and channels and the details of MQ. The hardware that it runs on is supported by infrastructure specialists who know about power usage, fan speeds, networking, etc. In the case of the appliance, the two are combined, so the MQ support people also need to be aware of the infrastructure monitoring. The meshIQ platform collects this additional detail and puts it all into a single view with explanatory help to empower the MQ administrators to support the complete appliance.