Published September 13, 2025
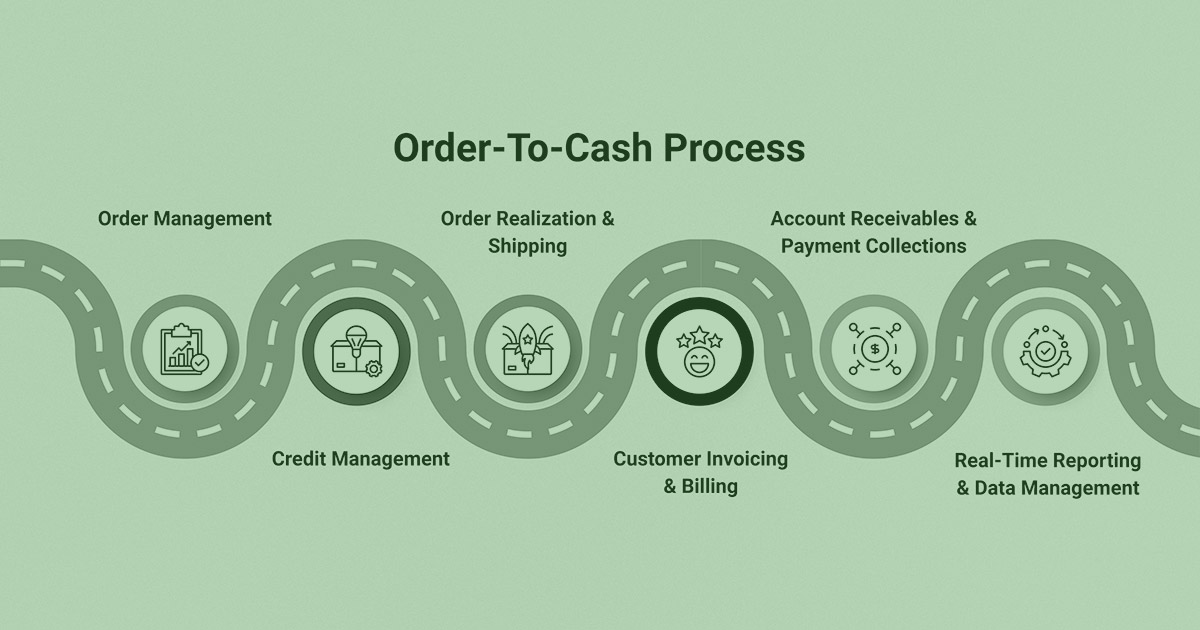
Whether you sell consumer goods, ship freight, manufacture vehicles, process payments, underwrite insurance, or manage hospital claims, your business depends on the same thing: order to cash.
Orders are created, fulfilled, invoiced, and paid.