meshIQ ActiveMQ Console
Unified Monitoring and Management for Apache ActiveMQ
The meshIQ Web Console is purpose-built for Apache ActiveMQ users who need a single, intuitive interface to monitor and manage their messaging infrastructure. With meshIQ, you gain real-time visibility, actionable insights, and deep analytics across brokers, queues, connectors, producers, and consumers—empowering you to maintain the health, performance, and reliability of your Apache ActiveMQ environment.
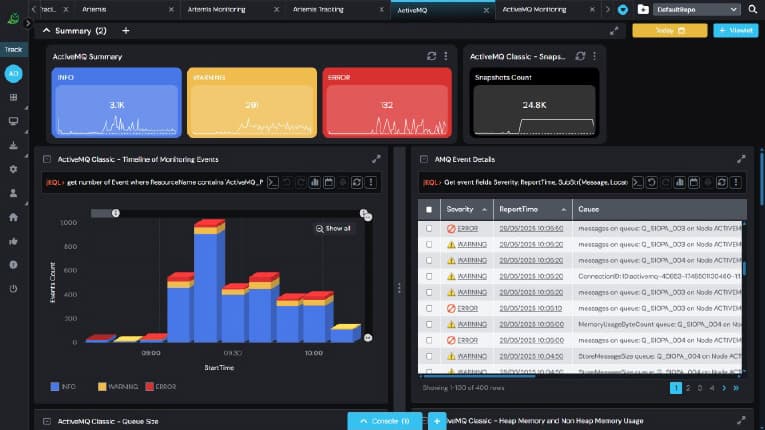
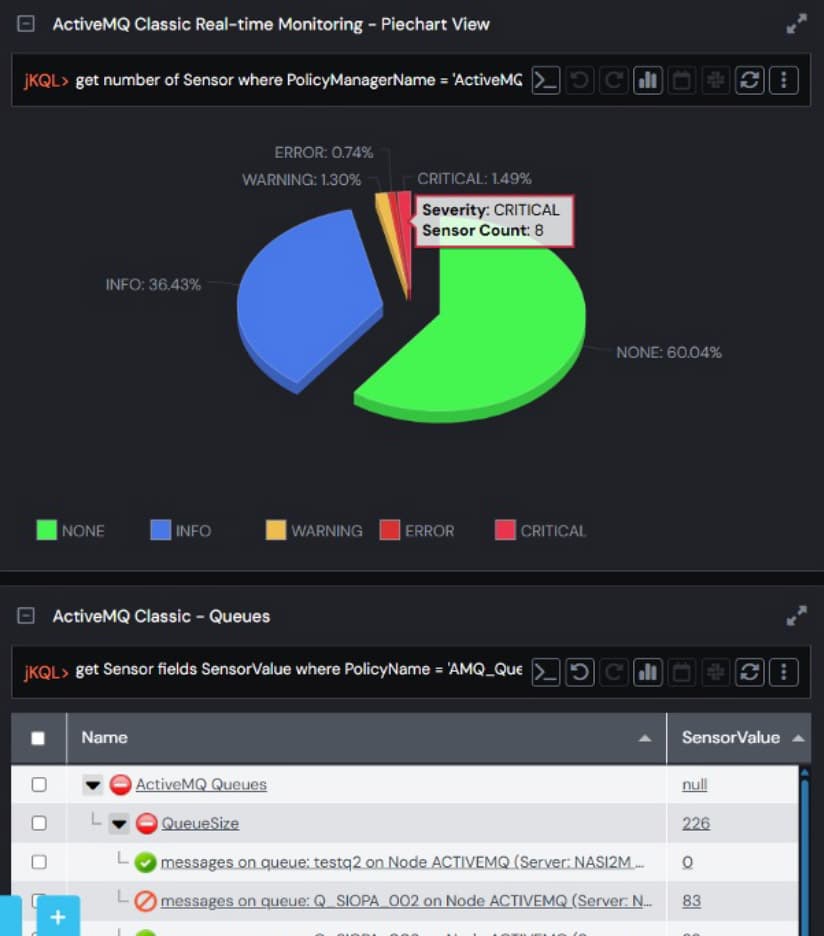
Real-Time Monitoring Dashboard
Stay on top of your Apache ActiveMQ brokers with a live dashboard that highlights key health metrics. Instantly see INFO, WARNING, and ERROR event counts, so you can quickly assess system status and respond to issues before they escalate.
Highlights:
- Live event tracking (INFO, WARNING, ERROR)
- Visual summary cards for rapid status checks.
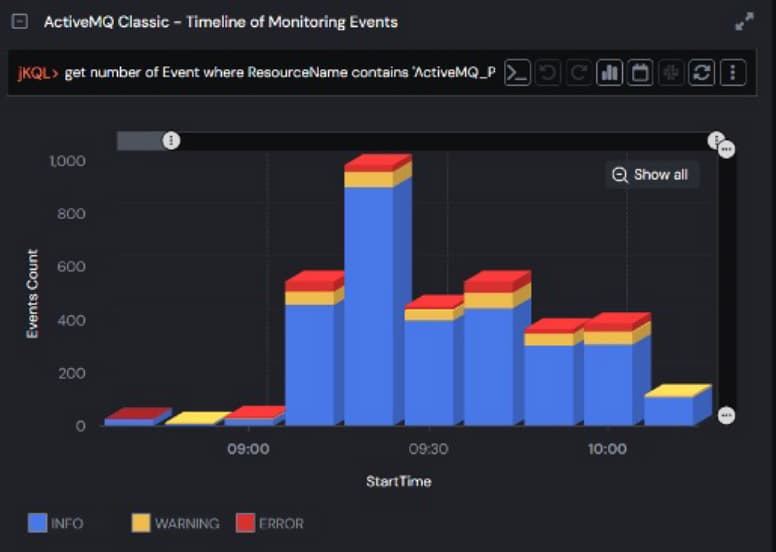
Event Timeline and Analytics
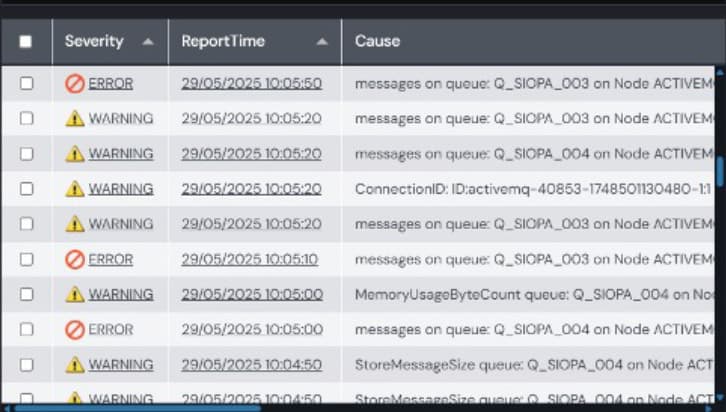
Visualize the flow of events over time with interactive charts. The meshIQ console makes it easy to spot trends, correlate incidents, and drill down into the details of any event.
Features:
- Stacked bar charts for event severity
- Click-through to event details
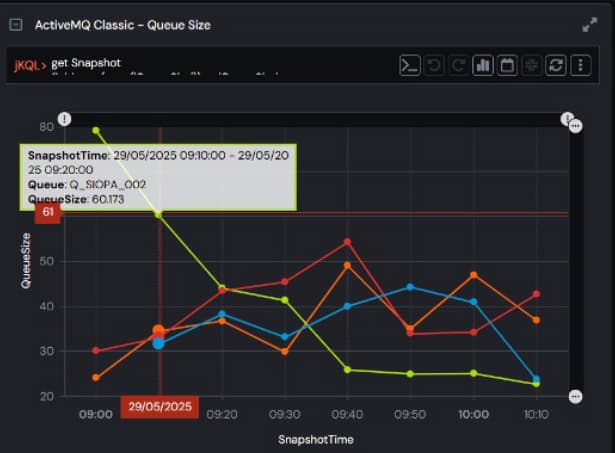
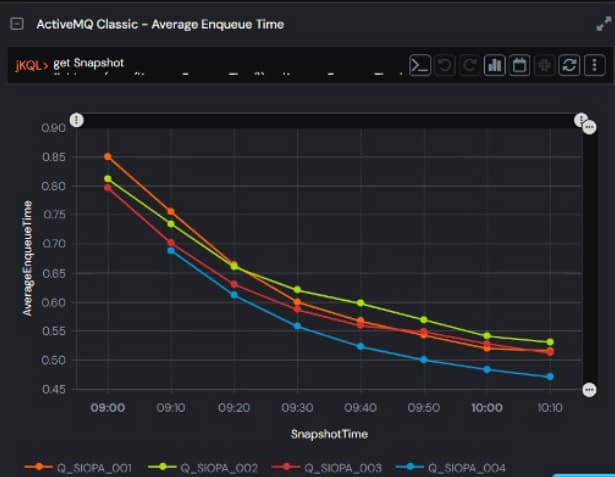
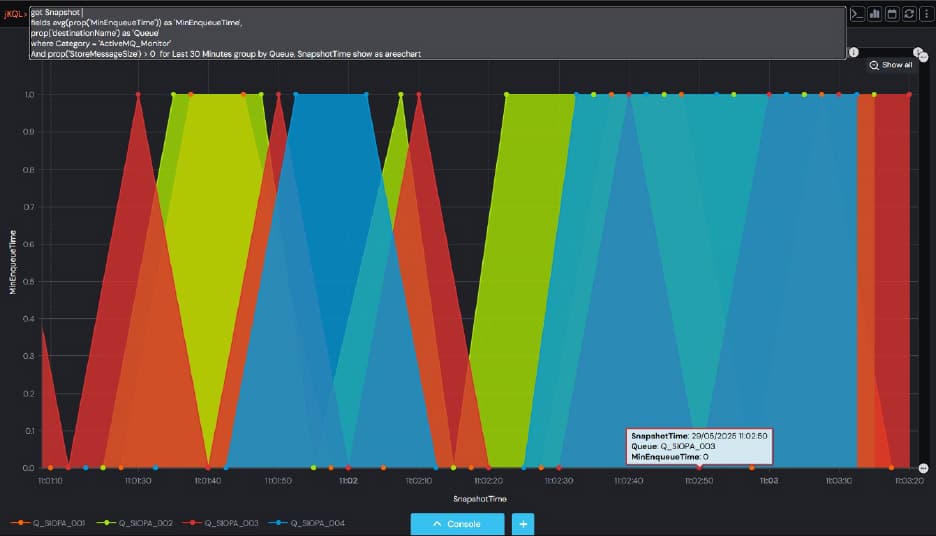
Deep Queue Analytics
Get granular visibility into every queue. Track queue size, enqueue/dequeue rates, and message backlogs with clear line charts. Instantly identify bottlenecks or abnormal growth, ensuring smooth message flow.
Metrics:
- Queue size trends
- Average and minimum enqueue times
- Store message size
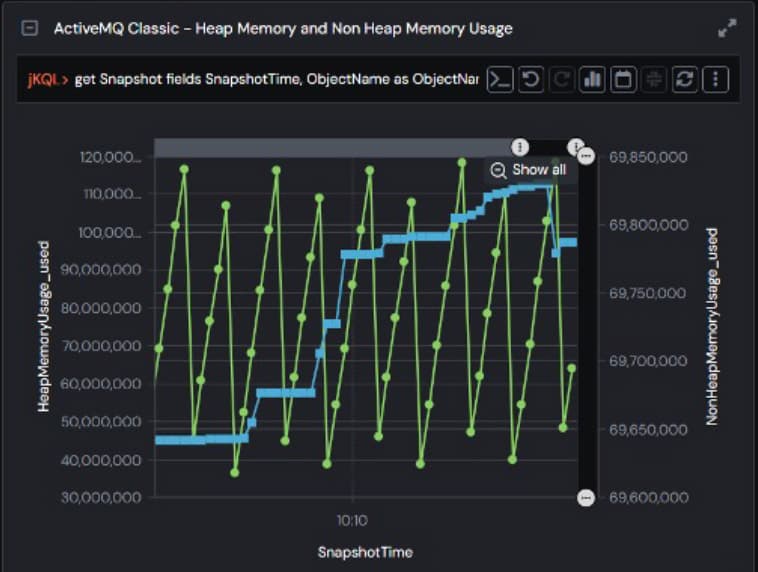
Memory and Resource Utilization
Optimize your broker resources with detailed memory usage analytics. Track heap and non-heap memory consumption over time, and monitor memory usage by queue to prevent outages and maximize efficiency.
Features:
- Heap and non-heap memory usage trends
- Memory usage by queue
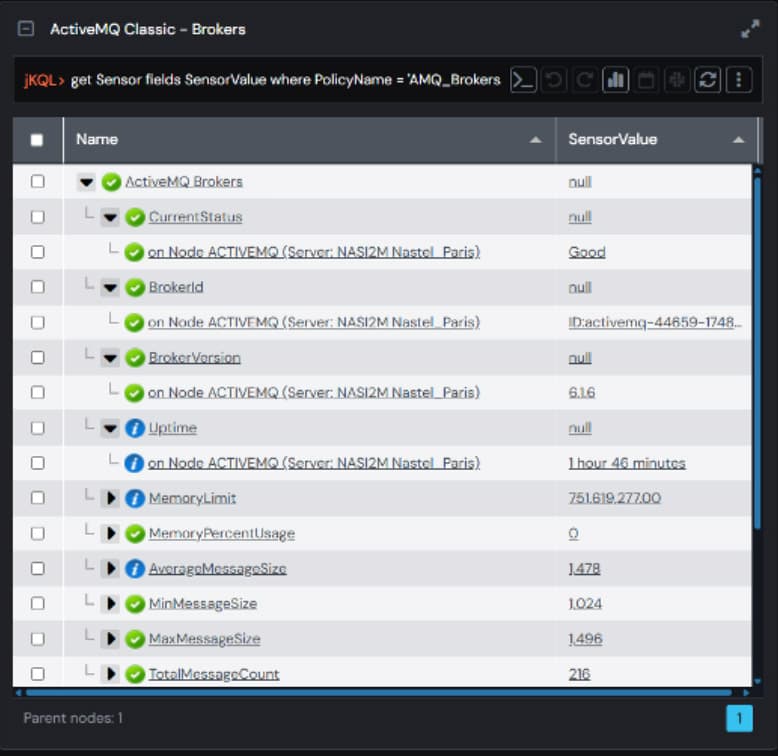
Broker Health and Status
Access a centralized view of all your Apache ActiveMQ brokers. See version, uptime, memory limits, and message statistics at a glance, making it easy to verify broker health and ensure compliance.
Displayed Information:
- Broker ID and version
- Uptime and memory usage
- Message size statistics
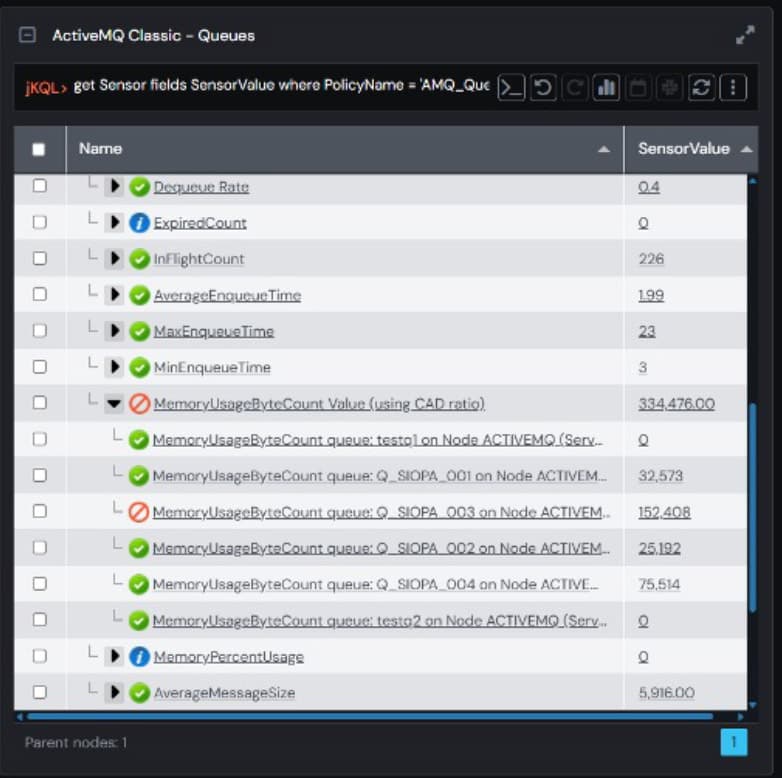
Queue Details and Performance
Dive deeper into queue performance with detailed tables and charts. Monitor in-flight message counts, consumer and producer activity, enqueue/dequeue rates, and per-queue memory usage.
Key Metrics:
- In-flight message count
- Consumer and producer statistics
- Memory and store usage per queue
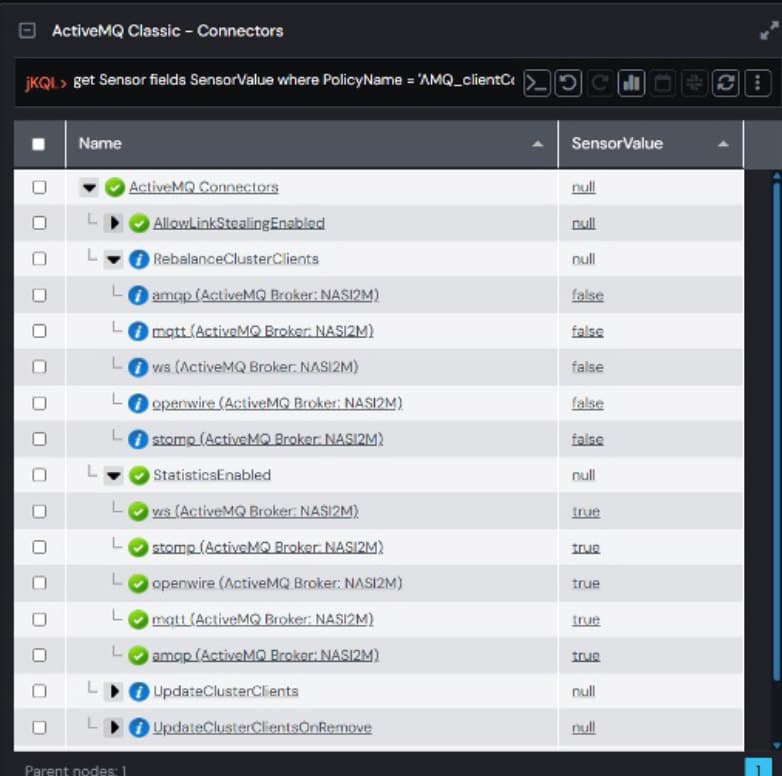
Connector and Client Visibility
Ensure all client connections are healthy and properly configured. The Connectors panel shows the status of every connector and protocol (AMQP, MQTT, STOMP, OpenWire, WebSocket), so you can quickly resolve connectivity issues.
Features:
- Connector status (enabled/disabled)
- Protocol support (AMQP, MQTT, STOMP, OpenWire, WebSocket)
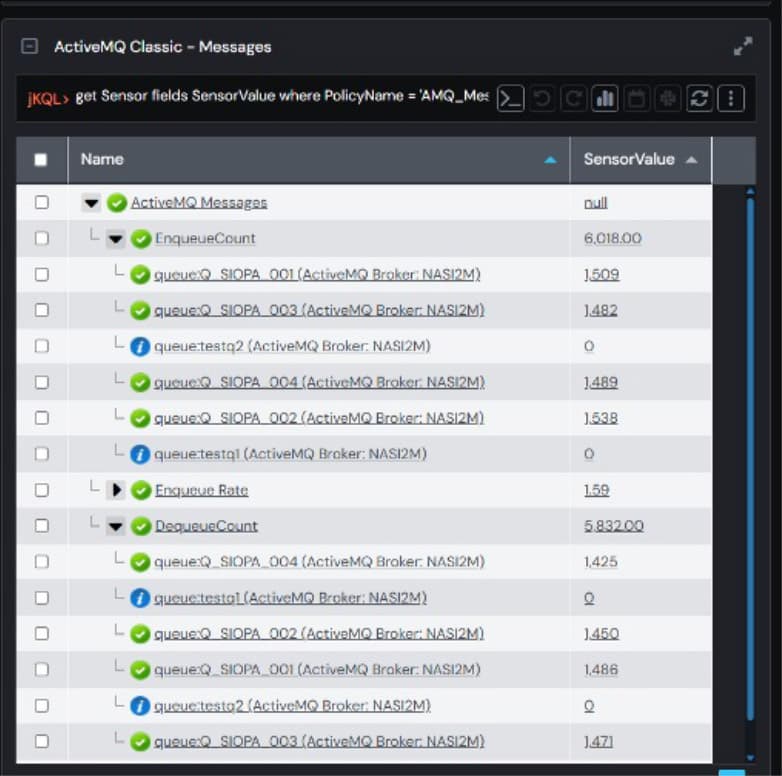
Message Flow and Throughput
Track message flow end-to-end. View detailed statistics on producers and consumers, including sent/received message counts, rates, and identification of slow consumers or blocked producers.
Metrics:
- Enqueue and dequeue counts and rates
- Producer and consumer connection details
- Pending and unconsumed messages
Apache ActiveMQ Support Subscription
Backed by Apache ActiveMQ experts and a best-in-class middleware console, meshIQ enables you to eliminate the risk of onboarding open-source technologies. Whether you are looking to swap out commercial messaging solutions with Apache ActiveMQ or need help with an existing Apache ActiveMQ environment, meshIQ is here to help.
Capabilities:
- 24×7 access to technical support
- Assistance with tuning, scalability and architecture
- Training and services engagements
Ready to take control of your Apache ActiveMQ environment?
With meshIQ, you get the clarity, control, and confidence you need to keep your messaging infrastructure running at its best.
Please reach out to us today. Contact Us to get started.